
1. Before you begin
In this codelab, you learn how to improve the runtime performance of a Compose app. You follow a scientific approach to measure, debug, and optimize performance. You investigate multiple performance issues with system tracing and change non-performant runtime code in a sample app, which contains several screens that represent different tasks.
Check out the following code-along for more support walking through this codelab:
The screens are each built differently and include the following:
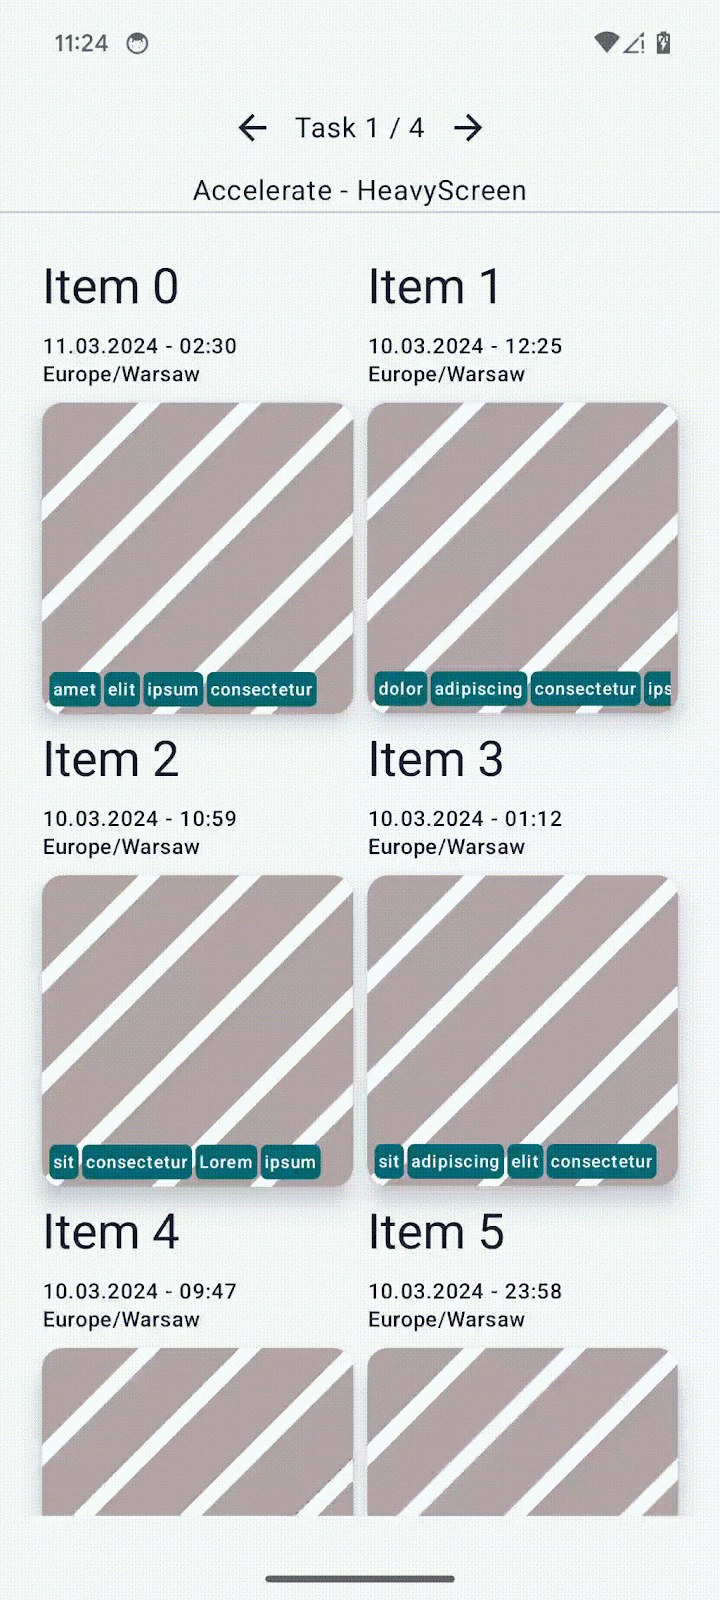
- The first screen is a two-column list with image items and some tags on top of the item. Here, you optimize heavy composables.
- The second and third screens contain a frequently recomposing state. Here, you remove unnecessary recompositions to optimize performance.


- The last screen contains unstable items. Here, you stabilize the items with various techniques.

Prerequisites
- Knowledge of how to build Compose apps.
- Basic understanding of testing or running macrobenchmarks.
What you learn
- How to pinpoint performance issues with system traces and composition tracing.
- How to write performant Compose apps that render smoothly.
What you need
- The latest stable version of Android Studio
- A physical Android device with Android 6 (API level 23) or higher
2. Get set up
To get started, follow these steps:
- Clone the GitHub repository:
$ git clone https://github.com/android/codelab-android-compose.git
Alternatively, you can download the repository as a zip file:
- Open the
PerformanceCodelabproject, which contains the following branches:
main: Contains the starter code for this project, where you make changes to complete the codelab.end: Contains the solution code for this codelab.
We recommend that you begin with the main branch and follow the codelab step-by-step at your own pace.
- If you want to see the solution code, run this command:
$ git clone -b end https://github.com/android/codelab-android-compose.git
Alternatively, you can download the solution code:
Optional: System traces used in this codelab
You will run several benchmarks that capture system traces during the codelab.
If you're not able to run these benchmarks, here's a list of system traces you can download instead:
3. Approach to fixing performance issues
Spotting slow, non-performant UI is possible with just plain sight and exploring the app. But before you jump in and start fixing code based on your assumptions, you should measure the performance of your code to understand if your changes will make a difference.
During development, with a debuggable build of your app, you might notice something is not as performant as needed and you might be tempted to start dealing with this problem. But a debuggable app's performance is not representative of what your users will see, so it's important to verify with a non-debuggable app that it actually is a problem. In a debuggable app, all of the code has to be interpreted by the runtime.
When thinking about performance in Compose, there's no hard rule you should follow to implement a particular functionality. You shouldn't do the following prematurely:
- Don't chase and fix every unstable parameter that sneaks into your code.
- Don't remove animations causing recomposition of that composable.
- Don't do hard-to-read optimizations based on your gut feeling.
All of these modifications should be done in an informed way using the available tools to be sure that they're addressing the performance issue.
When dealing with performance issues, you should follow this scientific approach:
- Establish the initial performance by measuring.
- Observe what's causing the problem.
- Modify the code based on the observations.
- Measure and compare with initial performance.
- Repeat.
If you don't follow any structured method, some of the changes might improve performance, but others might degrade it, and you can end up with the same outcome.
We recommend watching the following video on enhancing app performance with Compose